If you want to understand Machine Learning you have to understand gradient descent, we have all heard that before ;). Since I am a visual person, I tried to not only think through the concept, but also to visualize it.
Based on Jeremy’s great notebook “How does a neural net really work?”, I created a notebook which visualizes gradient descent in 3D. There are two version:
- The Kaggle version in which you can easily also play with the visualizations interactively (by copying and running the notebook)
- The GitHub version if you prefer to work on your own machine
The backstory
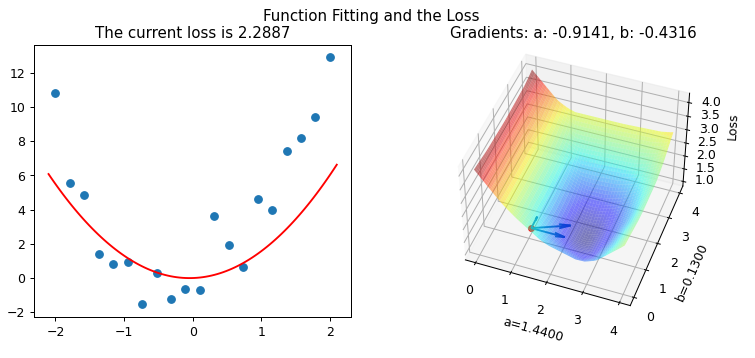
Gradient descent is one of the topics of lesson 3 of the 2022-Fast.AI-Course. On a high level, it is pretty straight forward:
- Calculate the predictions and the loss (forward-pass)
- Initialize and calculate the gradients (i.e. derivatives of the parameters, i.e. how does changing the parameters change the loss) (backward-pass)
- Update the parameters (via the learning rate)
- Restart
Looking at the python code, however, it is very compact, and a lot of magic is going on. Trying to unpack this and to get a solid and intuit understanding of gradient descent, I tried to not only think through the concept, but also to visualize it.
I started playing with Jeremy’s notebook, and what started out as a rough idea turned into the notebooks on Kaggle and GitHub.
I learned a lot about gradient descent and python (especially plotting) along the way, and I hope you find the visualizations useful.